

Forest and Grassland Resources Research ›› 2024›› Issue (4): 113-125.doi: 10.13466/j.cnki.lczyyj.2024.04.013
• Technical Application • Previous Articles Next Articles
WANG Tingqin1,2( ), CHEN Zimeng2, CHENG Linsong3, ZHAO Zheng4,5, XIA Jianxin1()
Received:2024-04-08
Revised:2024-06-28
Online:2024-08-28
Published:2025-04-18
CLC Number:
WANG Tingqin, CHEN Zimeng, CHENG Linsong, ZHAO Zheng, XIA Jianxin. The Ecosystem Service Value and Changes of in the Mu Us Sandy Land[J]. Forest and Grassland Resources Research, 2024, (4): 113-125.
Add to citation manager EndNote|Ris|BibTeX
URL: https://www.lyzygl.com.cn/EN/10.13466/j.cnki.lczyyj.2024.04.013
Tab.1
Land use type changes in the Mu Us Sandy Land from 2000 to 2020
| 土地利用 类型 | 面积/万hm2 | 动态度/% | |||||||||||
|---|---|---|---|---|---|---|---|---|---|---|---|---|---|
| 2000年 | 2005年 | 2010年 | 2015年 | 2020年 | 2000— 2020年 | 2000— 2005年 | 2005— 2010年 | 2010— 2015年 | 2015— 2020年 | 2000— 2020年 | |||
| 耕地 | 30.67 | 30.14 | 32.18 | 32.57 | 32.37 | 1.70 | -0.34 | 1.35 | 0.24 | -0.12 | 0.28 | ||
| 林地 | 8.83 | 10.23 | 9.98 | 9.79 | 9.75 | 0.92 | 3.16 | -0.49 | -0.38 | -0.07 | 0.52 | ||
| 草地 | 191.44 | 183.98 | 190.12 | 189.09 | 182.94 | -8.49 | -0.78 | 0.67 | -0.11 | -0.65 | -0.22 | ||
| 水域 | 2.00 | 1.72 | 1.26 | 1.28 | 1.30 | -0.70 | -2.84 | -5.36 | 0.43 | 0.26 | -1.75 | ||
| 湿地 | 5.54 | 5.98 | 4.73 | 4.60 | 6.49 | 0.95 | 1.59 | -4.18 | -0.56 | 8.24 | 0.86 | ||
| 未利用地 | 145.08 | 151.10 | 143.31 | 143.39 | 145.66 | 0.57 | 0.83 | -1.03 | 0.01 | 0.32 | 0.02 | ||
| 建设用地 | 1.49 | 1.91 | 3.49 | 4.33 | 6.53 | 5.04 | 5.56 | 16.52 | 4.85 | 10.15 | 16.86 | ||
Tab.2
Land use type transition matrix in the Mu Us Sandy Land from 2000 to 2005 万hm2
| 2005年 | ||||||||
|---|---|---|---|---|---|---|---|---|
| 耕地 | 林地 | 草地 | 水域 | 湿地 | 未利用地 | 建设用地 | ||
| 2000年 | 耕地 | 29.03 | 0.30 | 1.16 | 0.01 | 0.03 | 0.04 | 0.10 |
| 林地 | 0.05 | 8.27 | 0.38 | 0.00 | 0.01 | 0.13 | 0.00 | |
| 草地 | 0.86 | 1.63 | 180.85 | 0.02 | 0.37 | 7.45 | 0.26 | |
| 水域 | 0.02 | 0.00 | 0.04 | 1.58 | 0.14 | 0.22 | 0.00 | |
| 湿地 | 0.07 | 0.00 | 0.02 | 0.02 | 5.39 | 0.03 | 0.00 | |
| 未利用地 | 0.12 | 0.04 | 1.52 | 0.08 | 0.04 | 143.23 | 0.05 | |
| 建设用地 | 0.00 | 0.00 | 0.00 | 0.00 | 0.00 | 0.00 | 1.49 | |
Tab.3
Land use type transition matrix in the Mu Us Sandy Land from 2005 to 2010 万hm2
| 2010年 | ||||||||
|---|---|---|---|---|---|---|---|---|
| 耕地 | 林地 | 草地 | 水域 | 湿地 | 未利用地 | 建设用地 | ||
| 2005年 | 耕地 | 28.70 | 0.11 | 0.85 | 0.01 | 0.07 | 0.13 | 0.27 |
| 林地 | 0.10 | 9.36 | 0.67 | 0.00 | 0.00 | 0.03 | 0.07 | |
| 草地 | 2.47 | 0.13 | 178.98 | 0.02 | 0.04 | 1.43 | 0.91 | |
| 水域 | 0.01 | 0.00 | 0.03 | 1.12 | 0.52 | 0.02 | 0.03 | |
| 湿地 | 0.04 | 0.01 | 1.67 | 0.03 | 3.92 | 0.25 | 0.05 | |
| 未利用地 | 0.66 | 0.29 | 7.77 | 0.08 | 0.17 | 141.37 | 0.77 | |
| 建设用地 | 0.21 | 0.07 | 0.15 | 0.00 | 0.02 | 0.06 | 1.40 | |
Tab.4
Land use type transition matrix in the Mu Us Sandy Land from 2010 to 2015 万hm2
| 2015年 | ||||||||
|---|---|---|---|---|---|---|---|---|
| 耕地 | 林地 | 草地 | 水域 | 湿地 | 未利用地 | 建设用地 | ||
| 2010年 | 耕地 | 31.85 | 0.01 | 0.14 | 0.00 | 0.05 | 0.07 | 0.05 |
| 林地 | 0.05 | 9.69 | 0.07 | 0.00 | 0.00 | 0.15 | 0.03 | |
| 草地 | 0.35 | 0.06 | 187.42 | 0.01 | 0.03 | 1.69 | 0.56 | |
| 水域 | 0.00 | 0.00 | 0.00 | 1.22 | 0.02 | 0.01 | 0.00 | |
| 湿地 | 0.01 | 0.00 | 0.20 | 0.00 | 4.48 | 0.01 | 0.03 | |
| 未利用地 | 0.27 | 0.02 | 1.26 | 0.04 | 0.02 | 141.44 | 0.25 | |
| 建设用地 | 0.03 | 0.00 | 0.02 | 0.00 | 0.00 | 0.02 | 3.42 | |
Tab.5
Land use type transition matrix in the Mu Us Sandy Land from 2015 to 2020 万hm2
| 2020年 | ||||||||
|---|---|---|---|---|---|---|---|---|
| 耕地 | 林地 | 草地 | 水域 | 湿地 | 未利用地 | 建设用地 | ||
| 2015年 | 耕地 | 28.28 | 0.19 | 2.55 | 0.03 | 0.09 | 0.89 | 0.54 |
| 林地 | 0.21 | 8.47 | 0.41 | 0.00 | 0.02 | 0.44 | 0.23 | |
| 草地 | 1.99 | 0.75 | 174.01 | 0.03 | 1.76 | 8.86 | 1.69 | |
| 水域 | 0.02 | 0.00 | 0.03 | 0.97 | 0.17 | 0.09 | 0.00 | |
| 湿地 | 0.07 | 0.00 | 0.08 | 0.19 | 4.05 | 0.18 | 0.03 | |
| 未利用地 | 1.55 | 0.28 | 5.05 | 0.08 | 0.32 | 134.67 | 1.43 | |
| 建设用地 | 0.24 | 0.07 | 0.81 | 0.00 | 0.09 | 0.52 | 2.61 | |
Tab.6
Ecosystem service value coefficient for different land type 元/hm2
| 服务类型 | 服务子类型 | 耕地 | 林地 | 草地 | 水域① | 湿地② | 未利用地③ |
|---|---|---|---|---|---|---|---|
| 供给服务 | 食物生产 | 843.05 | 192.64 | 178.02 | 389.10 | 305.18 | 3.81 |
| 原料生产 | 186.92 | 442.51 | 261.94 | 381.47 | 87.74 | 11.44 | |
| 水资源供给 | -995.64 | 228.88 | 144.96 | 1 976.03 | 3 986.39 | 7.63 | |
| 调节服务 | 气体调节 | 679.02 | 1 455.32 | 920.62 | 1 449.60 | 362.40 | 49.59 |
| 气候调节 | 354.77 | 4 354.51 | 2 433.80 | 2 746.60 | 1 079.57 | 38.15 | |
| 净化环境 | 103.00 | 1 276.03 | 803.64 | 2 746.60 | 2 178.21 | 156.40 | |
| 水文调节 | 1 140.60 | 2 849.60 | 1 782.75 | 18 486.17 | 41 721.69 | 91.55 | |
| 支持服务 | 土壤保持 | 396.73 | 1 771.94 | 1 121.53 | 1 762.40 | 354.77 | 57.22 |
| 维持养分循环 | 118.26 | 135.42 | 86.47 | 137.33 | 26.70 | 3.81 | |
| 生物多样性 | 129.70 | 1 613.63 | 1 019.80 | 6 004.38 | 976.57 | 53.41 | |
| 文化服务 | 美学景观 | 57.22 | 707.63 | 450.14 | 3 608.73 | 755.32 | 22.89 |
Tab.7
Changes in ESV of different land types in Mu Us Sandy Land from 2000 to 2020
| 土地利用 类型 | ESV/亿元 | 贡献率/% | |||||||||||
|---|---|---|---|---|---|---|---|---|---|---|---|---|---|
| 2000年 | 2005年 | 2010年 | 2015年 | 2020年 | 2000— 2020年 | 2000年 | 2005年 | 2010年 | 2015年 | 2020年 | 2000— 2020年 | ||
| 耕地 | 9.24 | 9.08 | 9.70 | 9.81 | 9.75 | 0.51 | 3.81 | 3.80 | 4.10 | 4.18 | 4.08 | 0.27 | |
| 林地 | 13.28 | 15.37 | 15.00 | 14.71 | 14.66 | 1.38 | 5.47 | 6.43 | 6.35 | 6.27 | 6.14 | 0.66 | |
| 草地 | 176.19 | 169.33 | 174.98 | 174.03 | 168.37 | -7.82 | 72.64 | 70.82 | 74.05 | 74.18 | 70.50 | -2.14 | |
| 水域 | 7.94 | 6.81 | 4.99 | 5.09 | 5.16 | -2.78 | 3.27 | 2.85 | 2.11 | 2.17 | 2.16 | -1.11 | |
| 湿地 | 28.72 | 31.00 | 24.52 | 23.83 | 33.65 | 4.93 | 11.84 | 12.97 | 10.38 | 10.16 | 14.09 | 2.25 | |
| 未利用地 | 7.19 | 7.49 | 7.11 | 7.11 | 7.22 | 0.03 | 2.97 | 3.13 | 3.01 | 3.03 | 3.02 | 0.06 | |
| 总体 | 242.56 | 239.08 | 236.30 | 234.58 | 238.82 | -3.75 | |||||||
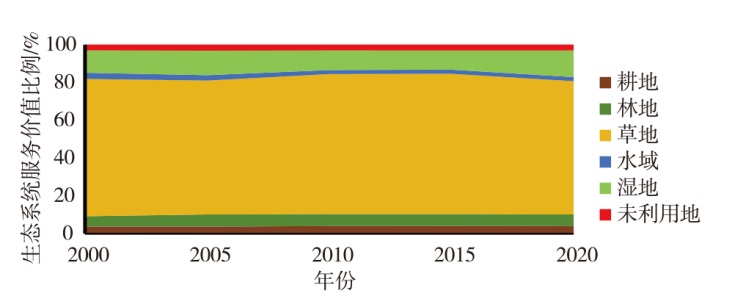
Fig.1
Proportion of ecosystem service value provided by different land use types from 2000 to 2020
Tab.8
Composition of ESV the Mu Us Sandy Land from 2000 to 2020
| 服务类型 | 服务项目 | ESV/亿元 | 贡献率/% | ||||||||||||||||
|---|---|---|---|---|---|---|---|---|---|---|---|---|---|---|---|---|---|---|---|
| 2000年 | 2005年 | 2010年 | 2015年 | 2020年 | 变化 | 2000年 | 2005年 | 2010年 | 2015年 | 2020年 | |||||||||
| 供给服务 | 食物生产 | 6.47 | 6.32 | 6.54 | 6.55 | 6.48 | 0.01 | 2.67 | 2.64 | 2.77 | 2.79 | 2.71 | |||||||
| 原料生产 | 6.27 | 6.13 | 6.28 | 6.25 | 6.10 | -0.17 | 2.58 | 2.56 | 2.66 | 2.66 | 2.56 | ||||||||
| 水资源供给 | 2.64 | 2.74 | 2.02 | 1.92 | 2.61 | -0.03 | 1.09 | 1.15 | 0.86 | 0.82 | 1.09 | ||||||||
| 调节服务 | 气体调节 | 22.20 | 21.69 | 22.20 | 22.11 | 21.61 | -0.60 | 9.15 | 9.07 | 9.40 | 9.42 | 9.05 | |||||||
| 气候调节 | 53.23 | 51.99 | 53.16 | 52.84 | 51.53 | -1.69 | 21.94 | 21.75 | 22.50 | 22.52 | 21.58 | ||||||||
| 净化环境 | 20.85 | 20.54 | 20.50 | 20.38 | 20.33 | -0.52 | 8.60 | 8.59 | 8.68 | 8.69 | 8.51 | ||||||||
| 水文调节 | 68.29 | 68.66 | 63.78 | 63.08 | 69.91 | 1.62 | 28.15 | 28.72 | 26.99 | 26.89 | 29.27 | ||||||||
| 支持服务 | 土壤保持 | 25.63 | 25.02 | 25.58 | 25.44 | 24.82 | -0.81 | 10.57 | 10.47 | 10.82 | 10.85 | 10.39 | |||||||
| 维持养分循环 | 2.24 | 2.18 | 2.24 | 2.24 | 2.19 | -0.05 | 0.92 | 0.91 | 0.95 | 0.95 | 0.92 | ||||||||
| 生物多样性 | 23.86 | 23.23 | 23.40 | 23.27 | 22.84 | -1.02 | 9.84 | 9.71 | 9.90 | 9.92 | 9.56 | ||||||||
| 文化服务 | 美学景观 | 10.89 | 10.60 | 10.59 | 10.53 | 10.40 | -0.49 | 4.49 | 4.43 | 4.48 | 4.49 | 4.36 | |||||||
Tab.9
ESV changes caused by land use type transition matrix in the Mu Us Sandy Land from 2000 to 2005 亿元
| 2005年 | ||||||||
|---|---|---|---|---|---|---|---|---|
| 耕地 | 林地 | 草地 | 水域 | 湿地 | 未利用地 | 建设用地 | ||
| 2000年 | 耕地 | 0.00 | 0.36 | 0.72 | 0.05 | 0.15 | -0.01 | -0.03 |
| 林地 | -0.06 | 0.00 | -0.22 | 0.00 | 0.03 | -0.19 | 0.00 | |
| 草地 | -0.53 | 0.95 | 0.00 | 0.06 | 1.56 | -6.48 | -0.24 | |
| 水域 | -0.06 | 0.00 | -0.11 | 0.00 | 0.17 | -0.88 | 0.00 | |
| 湿地 | -0.35 | -0.01 | -0.09 | -0.03 | 0.00 | -0.17 | 0.00 | |
| 未利用地 | 0.03 | 0.05 | 1.33 | 0.32 | 0.22 | 0.00 | 0.00 | |
| 建设用地 | 0.00 | 0.00 | 0.00 | 0.00 | 0.00 | 0.00 | 0.00 | |
Tab.10
ESV changes caused by land use type transition matrix in the Mu Us Sandy Land from 2005 to 2010 亿元
| 2010年 | ||||||||
|---|---|---|---|---|---|---|---|---|
| 耕地 | 林地 | 草地 | 水域 | 湿地 | 未利用地 | 建设用地 | ||
| 2005年 | 耕地 | 0.00 | 0.14 | 0.53 | 0.03 | 0.35 | -0.03 | -0.08 |
| 林地 | -0.12 | 0.00 | -0.39 | 0.00 | 0.00 | -0.05 | -0.10 | |
| 草地 | -1.53 | 0.08 | 0.00 | 0.06 | 0.17 | -1.25 | -0.83 | |
| 水域 | -0.02 | 0.00 | -0.09 | 0.00 | 0.63 | -0.07 | -0.10 | |
| 湿地 | -0.21 | -0.05 | -7.13 | -0.03 | 0.00 | -1.31 | -0.27 | |
| 未利用地 | 0.17 | 0.42 | 6.76 | 0.32 | 0.85 | 0.00 | -0.04 | |
| 建设用地 | 0.06 | 0.11 | 0.14 | 0.00 | 0.08 | 0.00 | 0.00 | |
Tab.11
ESV changes caused by land use type transition matrix in the Mu Us Sandy Land from 2010 to 2015 亿元
| 2015年 | ||||||||
|---|---|---|---|---|---|---|---|---|
| 耕地 | 林地 | 草地 | 水域 | 湿地 | 未利用地 | 建设用地 | ||
| 2010年 | 耕地 | 0.00 | 0.01 | 0.09 | 0.01 | 0.26 | -0.02 | -0.01 |
| 林地 | -0.06 | 0.00 | -0.04 | 0.00 | 0.00 | -0.21 | -0.04 | |
| 草地 | -0.22 | 0.04 | 0.00 | 0.04 | 0.11 | -1.47 | -0.51 | |
| 水域 | -0.01 | 0.00 | -0.01 | 0.00 | 0.02 | -0.05 | 0.00 | |
| 湿地 | -0.03 | 0.00 | -0.83 | 0.00 | 0.00 | -0.07 | -0.16 | |
| 未利用地 | 0.07 | 0.04 | 1.09 | 0.17 | 0.08 | 0.00 | -0.01 | |
| 建设用地 | 0.01 | 0.00 | 0.01 | 0.00 | 0.01 | 0.00 | 0.00 | |
Tab.12
ESV changes caused by land use type transition matrix in the Mu Us Sandy Land from 2015 to 2020 亿元
| 2020年 | ||||||||
|---|---|---|---|---|---|---|---|---|
| 耕地 | 林地 | 草地 | 水域 | 湿地 | 未利用地 | 建设用地 | ||
| 2015年 | 耕地 | 0.00 | 0.23 | 1.58 | 0.09 | 0.43 | -0.22 | -0.16 |
| 林地 | -0.25 | 0.00 | -0.24 | 0.00 | 0.08 | -0.64 | -0.35 | |
| 草地 | -1.23 | 0.43 | 0.00 | 0.10 | 7.48 | -7.72 | -1.55 | |
| 水域 | -0.07 | 0.00 | -0.08 | 0.00 | 0.20 | -0.35 | -0.01 | |
| 湿地 | -0.36 | -0.01 | -0.34 | -0.23 | 0.00 | -0.91 | -0.16 | |
| 未利用地 | 0.39 | 0.41 | 4.40 | 0.31 | 1.66 | 0.00 | -0.07 | |
| 建设用地 | 0.07 | 0.10 | 0.74 | 0.02 | 0.44 | 0.03 | 0.00 | |
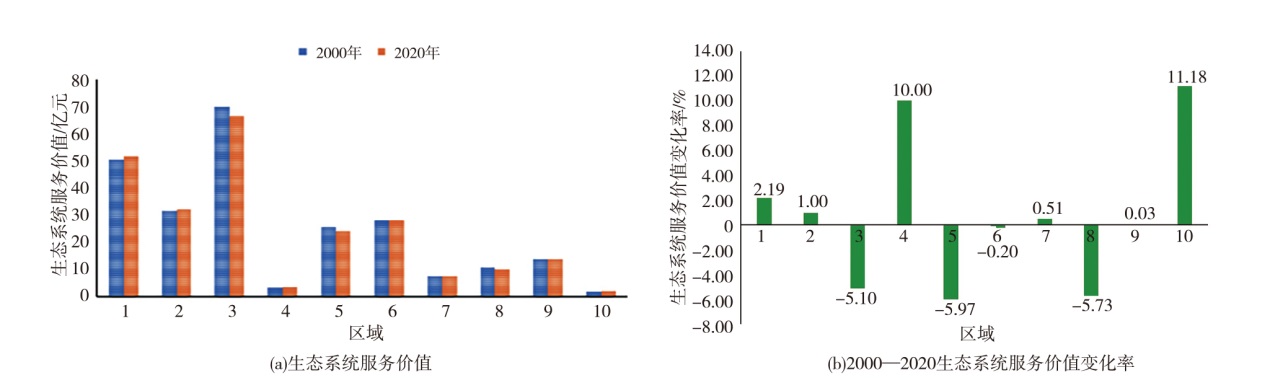
Fig.2
Ecosystem service value and change rate
Tab.13
Sensitivity coefficients of ESV to its value coefficients in Mu Us Sandy Land from 2000 to 2020
| 土地利用 类型 | 价值 系数 | ESV/亿元 | CS | |||||||||
|---|---|---|---|---|---|---|---|---|---|---|---|---|
| 2000年 | 2005年 | 2010年 | 2015年 | 2020年 | 2000年 | 2005年 | 2010年 | 2015年 | 2020年 | |||
| 耕地 | +50% | 13.86 | 13.63 | 14.55 | 14.72 | 14.63 | 0.038 | 0.038 | 0.041 | 0.042 | 0.041 | |
| 耕地 | -50% | 4.62 | 4.54 | 4.85 | 4.91 | 4.88 | ||||||
| 林地 | +50% | 19.92 | 23.06 | 22.50 | 22.07 | 21.99 | 0.055 | 0.064 | 0.063 | 0.063 | 0.061 | |
| 林地 | -50% | 6.64 | 7.69 | 7.50 | 7.36 | 7.33 | ||||||
| 草地 | +50% | 264.29 | 253.99 | 262.48 | 261.05 | 252.56 | 0.726 | 0.708 | 0.741 | 0.742 | 0.705 | |
| 草地 | -50% | 88.10 | 84.66 | 87.49 | 87.02 | 84.19 | ||||||
| 水域 | +50% | 11.91 | 10.22 | 7.48 | 7.64 | 7.74 | 0.033 | 0.029 | 0.021 | 0.022 | 0.022 | |
| 水域 | -50% | 3.97 | 3.41 | 2.49 | 2.55 | 2.58 | ||||||
| 湿地 | +50% | 43.08 | 46.50 | 36.78 | 35.75 | 50.48 | 0.118 | 0.130 | 0.104 | 0.102 | 0.141 | |
| 湿地 | -50% | 14.36 | 15.50 | 12.26 | 11.92 | 16.83 | ||||||
| 未利用地 | +50% | 10.79 | 11.24 | 10.66 | 10.67 | 10.83 | 0.030 | 0.031 | 0.030 | 0.030 | 0.030 | |
| 未利用地 | -50% | 3.60 | 3.75 | 3.55 | 3.56 | 3.61 | ||||||
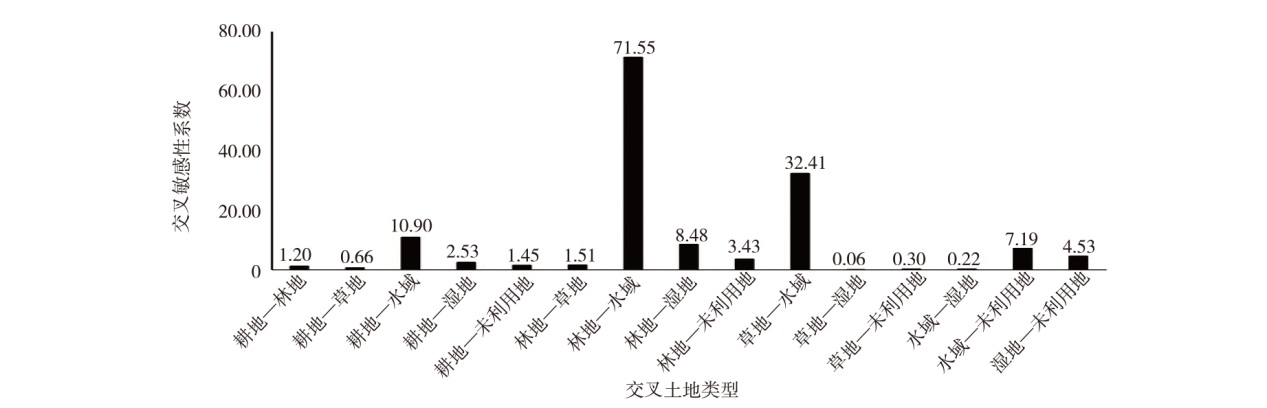
Tab.14
Cross-sensitivity coefficients based on total land use type conversion
| 相互转换的 土地类型 | 改进的交叉敏感性系数CCS | ||||
|---|---|---|---|---|---|
| 2000—2005年 | 2005—2010年 | 2010—2015年 | 2015—2020年 | 2000—2020年 | |
| 耕地—林地 | 0.82 | 1.12 | 2.59 | 0.95 | 1.20 |
| 耕地—草地 | 0.79 | 0.38 | 1.62 | 0.44 | 0.66 |
| 耕地—水域 | 7.87 | 12.37 | 28.06 | 7.02 | 10.90 |
| 耕地—湿地 | 2.50 | 1.84 | 2.23 | 2.05 | 2.53 |
| 耕地—未利用地 | 7.90 | 1.34 | 0.00 | 0.65 | 1.45 |
| 林地—草地 | 0.71 | 1.43 | 5.55 | 1.54 | 1.51 |
| 林地—水域 | 79.75 | 165.30 | 165.94 | 32.87 | 71.55 |
| 林地—湿地 | 10.39 | 6.32 | 36.43 | 4.99 | 8.48 |
| 林地—未利用地 | 6.61 | 2.93 | 3.20 | 1.91 | 3.43 |
| 草地—水域 | 24.56 | 21.43 | 38.04 | 29.04 | 32.41 |
| 草地—湿地 | 0.14 | 0.03 | 0.10 | 0.03 | 0.06 |
| 草地—未利用地 | 0.27 | 0.21 | 0.00 | 0.22 | 0.30 |
| 水域—湿地 | 0.33 | 0.08 | 1.14 | 0.15 | 0.22 |
| 水域—未利用地 | 3.45 | 8.88 | 0.00 | 7.73 | 7.19 |
| 湿地—未利用地 | 14.09 | 2.19 | 18.22 | 2.67 | 4.53 |
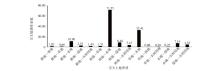
Fig.3
Cross-sensitivity coefficients based on total land use type conversion(2000—2020)
| [1] | 新华社. 习近平在内蒙古巴彦淖尔考察并主持召开加强荒漠化综合防治和推进“三北”等重点生态工程建设座谈会[EB/OL].(2023-06-06)[2024-04-08]. https://www.gov.cn/yaowen/liebiao/202306/content_6884930.htm. |
| [2] | 王翠萍, 韩小红, 王昊琛, 等. 1982—2020年毛乌素沙地植被对气候变化的响应[J]. 林业资源管理, 2023(3):80-89. |
| [3] |
王岳, 刘学敏, 哈斯额尔敦. 荒漠化治理“经济-生态-社会”效益耦合协调度时空分异及其驱动因素:以毛乌素沙地为例[J]. 资源科学, 2022, 44(6):1224-1237.
doi: 10.18402/resci.2022.06.10 |
| [4] |
卜凡蕊, 刘颖, 邹学勇. 中国东部典型沙地植被覆盖度对降水变化的响应[J]. 中国沙漠, 2023, 43(3):9-20.
doi: 10.7522/j.issn.1000-694X.2022.00124 |
| [5] | RAMACHANDRA T V. Land use land cover change analysis for sustainable management of ecosystems[J]. International Journal of Remote Sensing, 2011, 32(18),4491-4505. |
| [6] | PHARO E, DAILY G C. Nature's Services:Societal dependence on natural ecosystems[J]. The Bryologist, 1998, 7:49-68. |
| [7] | 房学宁, 赵文武. 生态系统服务研究进展:2013年第11届国际生态学大会(INTECOL Congress)会议述评[J]. 生态学报, 2013, 33(20):6736-6740. |
| [8] | LANGERWISCH F, VÁCLAVÍK T, VON BLOH W, et al. Combined effects of climate and land-use change on the provision of ecosystem services in rice agro-ecosystems[J]. Environmental Research Letters, 2018, 13(1):015003. |
| [9] | TOLESSA T, SENBETA F, KIDANE M. The impact of land use/land cover change on ecosystem services in the central highlands of Ethiopia[J]. Ecosystem Services, 2017, 23:47-54. |
| [10] | DICKS L V, FLORA C B, GODFRAY H C J. Farming and the environment III.horizon scanning for future threats and opportunities in agriculture[J]. Journal of Environmental Management, 2020, 261,110685. |
| [11] | COSTANZA R,ARGE, GROOT R D, et al. The value of the world's ecosystem services and natural capital[J]. Nature, 1997, 387(15):253-260. |
| [12] | 张永民. 生态系统服务研究的几个基本问题[J]. 资源科学, 2012, 34(4):725-733. |
| [13] | 郑德凤, 臧正, 孙才志, 等. 基于生态系统服务理论的中国绿色经济转型预测分析[J]. 生态学报, 2014, 34(23):7137-7147. |
| [14] | GROOT R D. Function-analysis and valuation as a tool to assess land use conflicts in planning for sustainable,multi-functional landscapes[J]. Landscape and Urban Planning, 2006, 75(3-4):175-186. |
| [15] | 蒋小荣, 李丁, 李智勇. 基于土地利用的石羊河流域生态服务价值[J]. 中国人口·资源与环境, 2010, 20(6):68-73. |
| [16] | ASSESMENT M E. Ecosystems and human well-being:synthesis[J]. Physics Teacher, 2005, 34(9):534-534. |
| [17] | 王孟超, 潘洪义, 高成, 等. 基于政策导向的岷江流域土地利用模拟及生态系统服务价值评估[J]. 长江流域资源与环境, 2024, 33(2):322-335. |
| [18] | 解文艳, 付永虎, 杨殿闯, 等. 基于土地利用变化的江苏省生态系统服务价值时空演变与模拟预测[J]. 地域研究与开发, 2022, 41(5):126-132. |
| [19] | FORSTER J, BARKMANN J, FRICKE R, et al. Assessing ecosystem services for informing land-use decisions:a problem-oriented approach[J]. Ecology and Society, 2015, 20(3):31. |
| [20] | HOONCHONG Y, GÜNERALP B, FILIPPI A M, et al. Impacts of land change on ecosystem services in the San Antonio river basin,Texas,from 1984 to 2010[J]. Ecological Economics, 2017, 135:125-135. |
| [21] | POLASKY S, NELSON E, PENNINGTON D, et al. The impact of land-use change on ecosystem services,biodiversity and returns to landowners:A case study in the state of Minnesota[J]. Environmental and Resource Economics, 2011, 48(2):219-242. |
| [22] | COSTANZA R, de GROOT R, SUTTON P, et al. Changes in the global value of ecosystem services[J]. Global Environmental Change, 2014, 26:152-158. |
| [23] | RADFORD K G, JAMES P. Changes in the value of ecosystem services along a rural-urban gradient:A case study of greater Manchester,UK[J]. Landscape and Urban Planning, 2013, 109(1):117-127. |
| [24] | 欧阳志云, 王效科, 苗鸿. 中国陆地生态系统服务功能及其生态经济价值的初步研究[J]. 生态学报, 1999, 19(5):607-613. |
| [25] |
傅伯杰, 张立伟. 土地利用变化与生态系统服务:概念、方法与进展[J]. 地理科学进展, 2014, 33(4):441-446.
doi: 10.11820/dlkxjz.2014.04.001 |
| [26] | 冯异星, 罗格平, 鲁蕾, 等. 土地利用变化对干旱区典型流域生态系统服务价值的影响[J]. 水土保持学报, 2009, 23(6):247-251. |
| [27] | 李屹峰, 罗跃初, 刘纲, 等. 土地利用变化对生态系统服务功能的影响:以密云水库流域为例[J]. 生态学报, 2013, 33(3):726-736. |
| [28] | 谢高地, 鲁春霞, 冷允法, 等. 青藏高原生态资产的价值评估[J]. 自然资源学报, 2003, 18(2):189-196. |
| [29] | 谢高地, 甄霖, 鲁春霞, 等. 一个基于专家知识的生态系统服务价值化方法[J]. 自然资源学报, 2008, 23(5):911-919. |
| [30] | 谢高地, 张彩霞, 张雷明, 等. 基于单位面积价值当量因子的生态系统服务价值化方法改进[J]. 自然资源学报, 2015, 30(8):1243-1254. |
| [31] | BOLUND P, HUNHAMMAR S. Ecosystem services in urban areas[J]. Ecological Economics, 1999, 29(2):293-301. |
| [32] | YIN Jie, YIN Zhane, ZHONG Haidong, et al. Monitoring urban expansion and land use/land cover changes of Shanghai metropolitan area during the transitional economy(1979—2009)in China[J]. Environmental Monitoring—Assessment, 2011, 177(1-4):609-621. |
| [33] | SU Shiliang, XIAO Rui, JIANG Zhenlan, et al. Characterizing landscape pattern and ecosystem service value changes for urbanization impacts at an eco-regional scale[J]. Applied Geography, 2012, 34:295-305. |
| [34] | WU Kaiya, YE Xinyue, QI Zhifang, et al. Impacts of land use/land cover change and socioeconomic development on regional ecosystem services:The case of fast-growing Hangzhou metropolitan area,China[J]. Cities, 2013, 31(2):276-284. |
| [35] | 薛晓玉, 王晓云, 段含明, 等. 北方农牧交错带植被NPP的时空变化及其驱动因子分析[J]. 水土保持研究, 2021, 28(2):190-197. |
| [36] | 赵晓萌, 程宏, 蒋宁, 等. 京津风沙源土壤风蚀时空格局及其演化[J]. 科学通报, 2023, 68(Z1):238-253. |
| [37] | 卢琦, 肖春蕾, 包英爽, 等. 打赢“三北”攻坚战,再造一个“新三北”:实现路径与战略规划[J]. 中国科学院院刊, 2023, 38(7):956-965. |
| [38] | 郭二果, 李现华, 祁瑜, 等. 国家北方重要生态安全屏障保护与建设[J]. 中国环境管理, 2021, 13(2):80-85. |
| [39] | 全国自然资源与国土空间规划标准化技术委员会. 土地利用现状分类:GB/T 21010—2017[S]. 北京: 中华人民共和国国家质量监督检验检疫总局,中国国家标准化管理委员会, 2017. |
| [40] | 余嘉琦, 李钢, 赵华, 等. 江苏省沛县土地利用变化及其生态服务价值研究[J]. 江苏农业科学, 2015, 43(6):371-376. |
| [41] | 朱会义, 李秀彬. 关于区域土地利用变化指数模型方法的讨论[J]. 地理学报, 2003, 58(5):643-650. |
| [42] | 高奇, 师学义, 黄勤, 等. 区域土地利用变化的生态系统服务价值响应[J]. 中国人口·资源与环境, 2013, 23(S2):308-312. |
| [43] | 张天海, 田野, 徐舒, 等. 滨海城市土地利用格局演变及对生态系统服务价值的影响[J]. 生态学报, 2018, 38(21):7572-7581. |
| [44] | 祖皮艳木·买买提, 玉米提·哈力克, 肉孜·阿基, 等. 基于生态系统服务价值变化的焉耆盆地环境与经济协调发展[J]. 应用生态学报, 2015, 26(3):875-883. |
| [45] | 温璐, 宋洁, 张慧超, 等. 近30年乌兰布和沙漠生态系统服务价值评估[J]. 干旱区资源与环境, 2020, 34(12):57-64. |
| [46] | 张丽琴, 渠丽萍, 吕春艳, 等. 基于空间格局视角的武汉市土地生态系统服务价值研究[J]. 长江流域资源与环境, 2018, 27(9):1988-1997. |
| [1] | LIU Bingcang, YANG Haijiang. Assessment of Forest Ecosystem Services Vlaue in the Qilian Mountain National Nature Reserve [J]. Forest and Grassland Resources Research, 2024, 0(3): 18-24. |
| [2] | BAI Xingwen, BU Rigude, HONG Guangyu, LI Wei, SHAO Feizhou, ZHANG Lei. Soil Moisture Characteristics and Its Response to Precipitation of Typical Plantation in Mu Us Sandy Land [J]. Forest and Grassland Resources Research, 2023, 0(6): 52-60. |
| [3] | GAO Shanshan, SHEN Yujie, HAI Xinquan. Evaluation of Forest Ecosystem Service Value in Ziwuling, Qingyang Based on Meta-Analysis [J]. Forest and Grassland Resources Research, 2023, 0(5): 80-88. |
| [4] | WANG Cuiping, HAN Xiaohong, WANG Haochen, YOU Jiaqi. Responses of Vegetation in Mu Us Sandy Land to Climate Change from 1982 to 2020 [J]. FOREST RESOURCES WANAGEMENT, 2023, 0(3): 80-89. |
| [5] | ZHANG Lei, HONG Guangyu, LI Zhuofan, GAO Xiaowei, HUANG Saren, WANG Zhuo, LIU Shanghua, WANG Xiaojiang. Assessment of Three Kinds of Reforestation Models Recovery Effect in Mu Us Sandy Land Based on Analytical Hierarchy Process [J]. FOREST RESOURCES WANAGEMENT, 2017, 0(6): 108-112. |
| Viewed | ||||||
|
Full text |
|
|||||
|
Abstract |
|
|||||