TONG Huiqin, LONG Fei, QI Huibo, ZHANG Zhe. Prediction and Simulation of the Potential Demand for Forest Carbon Sequestration in Seven Pilot Carbon Markets[J]. FOREST RESOURCES WANAGEMENT, 2019, 0(4): 10-17.
CO2 marginal abatement cost in the emission reduction industries of 7 pilot provinces and cities from 2007 to 2016万元/吨
年份
上海市
天津市
北京市
重庆市
深圳市
广东省
湖北省
平均
2007
12.1266
298.2347
0.0303
0.0303
3.3578
0.0305
0.2625
44.8675
2008
12.1981
0.0302
0.0303
31.2746
0.0303
0.0301
10.6420
7.7479
2009
297.2407
0.0301
1.6769
37.1273
297.0405
295.1107
295.6412
174.8382
2010
1.2844
3.6358
1.7345
296.7244
10.0978
2.0745
5.1546
45.8151
2011
0.0303
7.3340
1.1189
22.6413
2.0706
0.1060
15.6471
6.9926
2012
0.7611
2.0133
296.6006
10.1897
9.7704
14.3344
9.7360
49.0579
2013
0.0303
1.9285
1.3673
56.3000
17.5981
0.5652
0.4971
11.1838
2014
0.3556
0.7392
0.0303
11.7376
0.6710
0.0301
0.0302
1.9420
2015
0.0303
0.0302
0.9178
20.6593
1.6555
5.5515
0.1403
4.1407
2016
0.0390
2.7143
0.0303
1.5029
0.0303
0.7512
0.0302
0.7283
平均
32.4096
31.6690
30.3537
48.8187
34.2322
31.8584
33.7781
34.7314
Tab.2
Tab.3
Potential demand for forest carbon sequestration in the pilot provinces and cities emission reduction industries in 2007—2016
年份
上海市
天津市
北京市
重庆市
深圳市
广东省
湖北省
平均
2007
4402.07
108738.99
11.03
11.29
1206.86
11.09
98.37
16354.24
2008
4420.28
10.98
10.99
11601.32
10.87
10.92
3960.00
2860.77
2009
107747.22
10.95
607.36
13747.05
106326.27
107070.87
109761.92
63610.23
2010
464.52
1320.87
626.65
108428.24
3613.52
750.69
1902.94
16729.63
2011
10.94
2659.89
403.30
8248.41
739.53
38.31
5740.90
2548.75
2012
274.89
729.58
106764.61
3705.51
3482.85
5181.35
3563.06
17671.69
2013
10.95
698.22
491.38
20420.98
6269.66
203.90
181.67
4039.54
2014
128.36
267.49
10.86
4247.42
239.01
10.84
11.02
702.14
2015
10.95
10.92
328.97
7462.72
589.44
1998.50
51.14
1493.23
2016
14.09
981.88
10.85
541.99
10.79
270.16
11.00
262.97
平均
11748.43
11542.98
10926.60
17841.49
12248.88
11554.66
12528.20
12627.32
Tab.3
Tab.4
Expccted value,entropy and hyper entropy of potential demand for forest carbon sequestration in pilot provinces and cities
Ex
En
He
0.2048
0.3666
0.0465
Tab.4
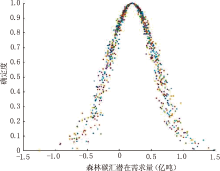
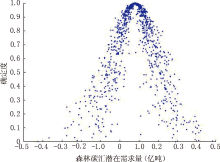
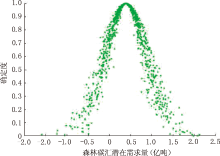
Fig.1
Potential demand for forest carbon sequestration in the 7 pilot provinces and cities(ten thousand tons)
Fig.1
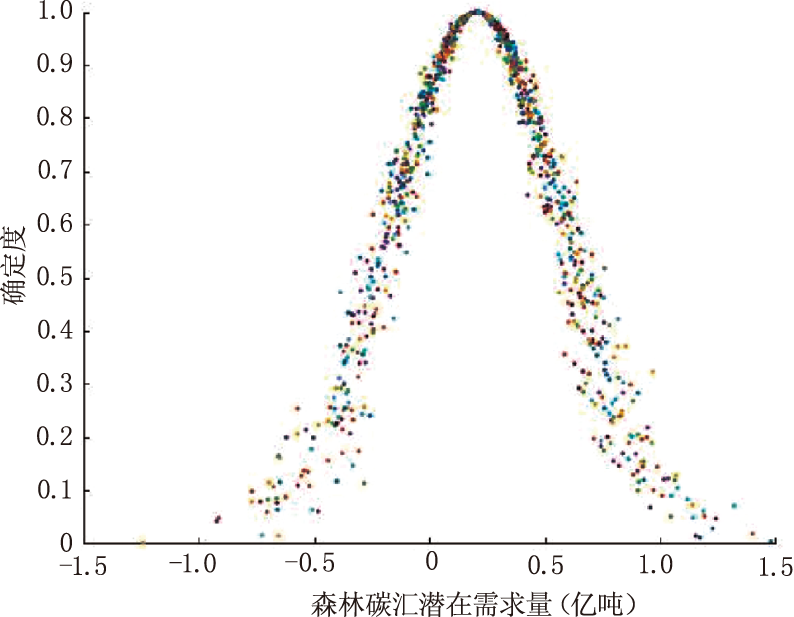
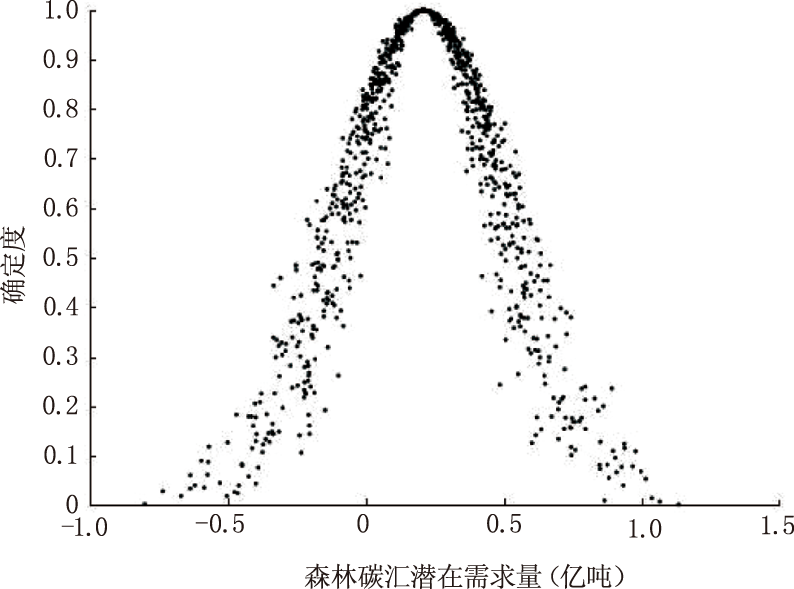
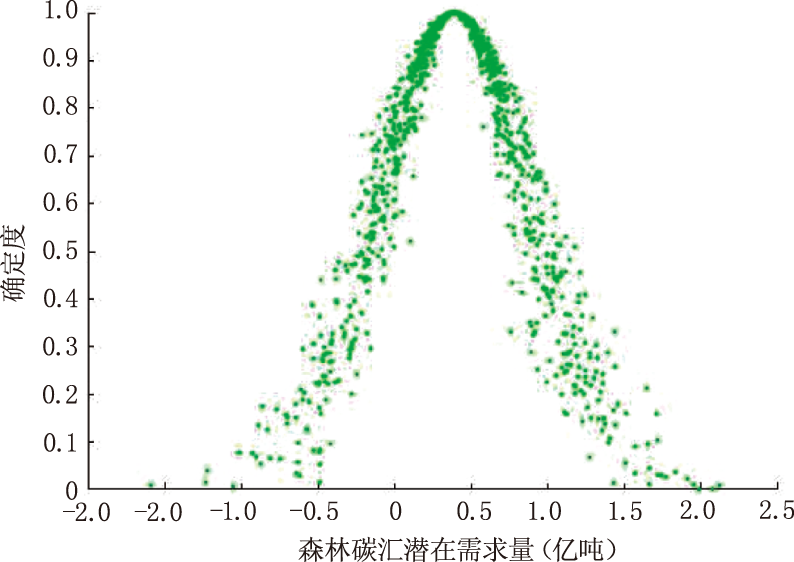
Fig.2
Prediction of potential demand for forest carbon sequestration under the change of corporate super-discharge penalties(ten thousand tons)
Fig.2
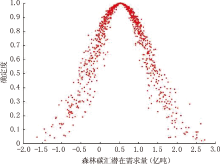
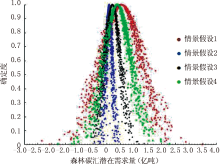
Fig.3
Prediction of potential demand for forest carbon sequestration under the change of enterprise's own technology emission reduction subsidies(ten thousand tons)
Fig.3
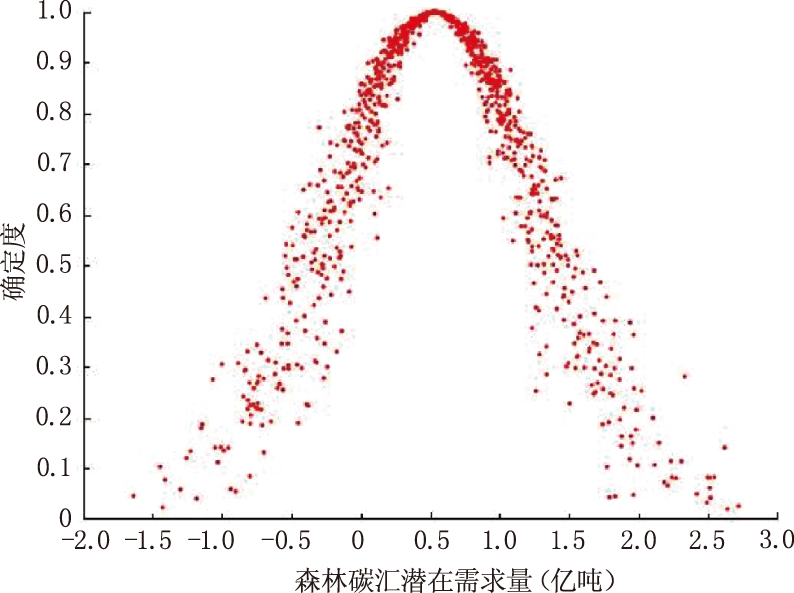
Fig.4
Prediction of potential demand for forest carbon sequestration under the change of corporate carbon emission quota intensity(ten thousand tons)
Fig.4
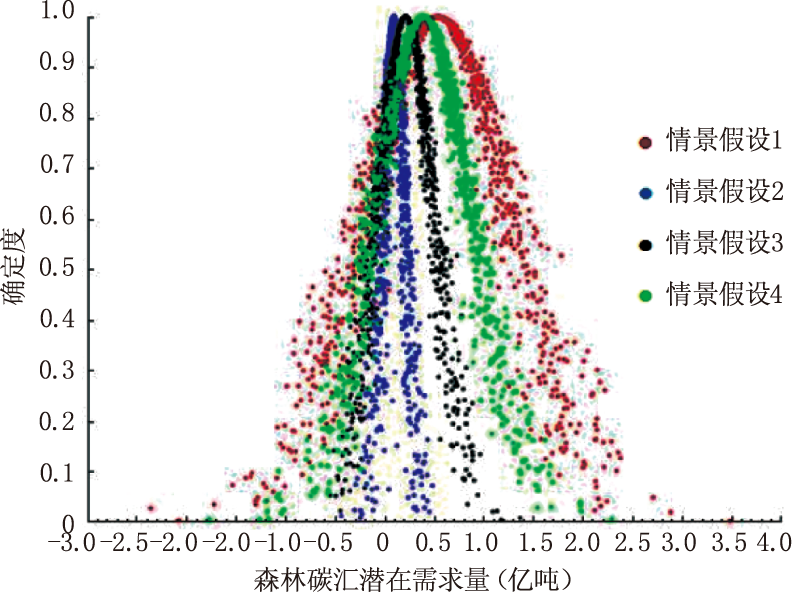
Fig.5
Prediction of potential demand for forest carbon sequestration under the change of industrial incentive policies(ten thousand tons)
Fig.5
Fig.6
Prediction of potential demand for forest carbon sequestration after four policy factor variables change together(ten thousand tons)
Schmalensee R, Stavins R N . Lessons learned from three decades of experience with cap and trade[J]. Review of Environmental Economics and Policy, 2017,11(1):59-79.
doi: 10.1093/reep/rew017
Zhou X, Fan L.W., Zhou P . Marginal CO2 abatement costs:Findings from alternative shadow price estimates for Shanghai industrial sectors[J]. Energy Policy, 2015(77):109-117.
[4]
Atsalakis . Using computational intelligence to forecast carbon prices[J]. Applied Soft Computing, 2016(43):107-116.
Vass M M . Renewable energies cannot compete with forest carbon sequestration to cost~efficiently meet the EU carbon target for 2050[J]. Renewable Energy, 2017(107):164-180.
[8]
Khanal P N, Grebner D L, Munn I A , et al. Evaluating non~industrial private forest landowner willingness to manage for forest carbon sequestration in the southern United States[J]. Forest Policy and Economics, 2017(75):112-119.
 ), LONG Fei(